The Sequence Pulse: The Architecture Powering Data Drift Detection at Uber
Data anonaly detection at massive scale.
In case you missed yesterday’s newsletter due to July the 4th holiday, we discussed the universe of in-context retrieval augmented LLMs or techniques that allow to expand the LLM knowledge without altering its core architecutre. It’s a good one. Go check it out.
Uber runs one of the most sophisticated data and machine learning(ML) infrastructures in the planet. It’s Michelangelo platform has been used as the reference architecture for many MLOps platforms over the last few years. Uber innvoations in ML and data span across all categories of the stack. Recently, the Uber engineering team unveiled some details about their work in data anomaly detections which is one of the most mainstream problems in ML workflows.
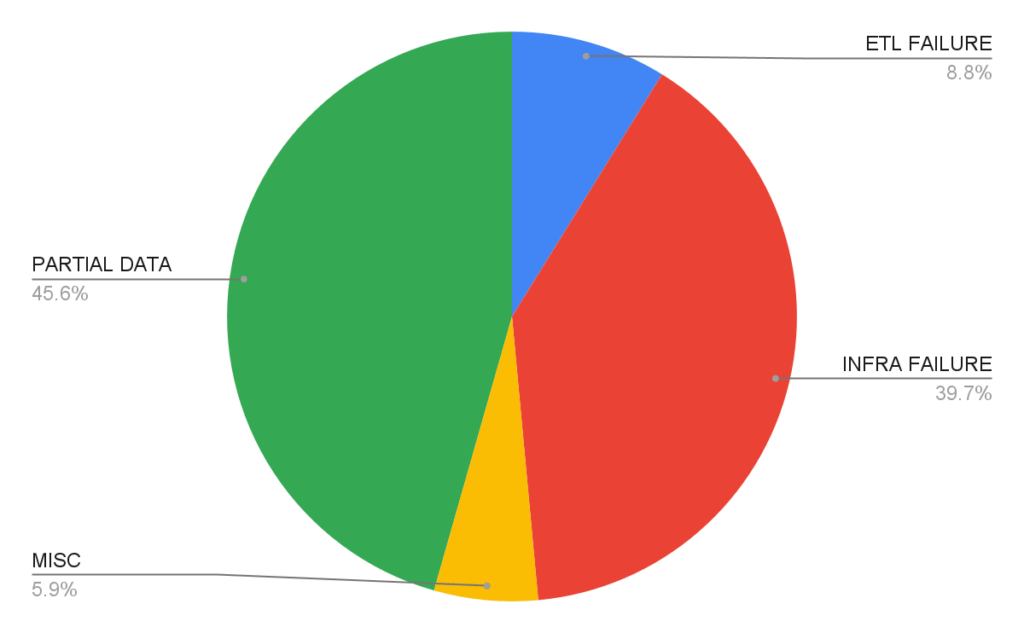
Like any large tech company, data is the backbone of the Uber platform. Not surprisingly, data quality and drifting is incredibly important. Many data drift error translates into poor performance of ML models which are not detected until the models have ran. A recent study of data drift issues at Uber reveled a highly diverse perspective.
Uber recognizes the need for a robust automated system that can effectively measure and monitor column-level data quality. With this objective in mind, Uber has developed D3, also known as the Dataset Drift Detector.
Inside D3
Automated Onboarding: D3 leverages offline usage to identify and prioritize important columns within a dataset. By applying monitors to these columns, D3 minimizes the need for extensive configuration from dataset owners during the onboarding process.
Automated Monitoring across Dimensions: D3 autonomously monitors data by various dimensions such as app version and city ID. This proactive approach enables faster detection of data issues and provides a more accurate assessment of data quality. Even if the overall data quality remains relatively stable, D3 identifies and addresses data issues that may significantly impact specific cities or other critical dimensions.
Automated Anomaly Detection: D3 eliminates the manual process of setting thresholds for anomaly detection. By leveraging advanced algorithms, it autonomously detects and alerts users about any deviations from expected data patterns.
The Architecture
The D3 architecture comprises several core systems managed by Uber's Data Platform, which play a crucial role in maintaining data quality. Here are the key systems briefly mentioned in this article:
Databook: An internal portal within Uber that facilitates dataset exploration. Databook provides valuable insights into datasets, including column information, lineage, data quality tests, metrics, SLAs, data consistency, duplicates, and more.
UDQ (Unified Data Quality): UDQ serves as a centralized system at Uber responsible for defining, executing, and maintaining data quality tests. It also ensures effective alerting mechanisms are in place for these tests at scale. Dataset owners can create and manage UDQ tests through the Databook platform.
Michelangelo: A powerful platform within Uber that enables real-time deployment of machine learning models across datasets. Michelangelo plays a vital role in enhancing data-driven decision-making processes.
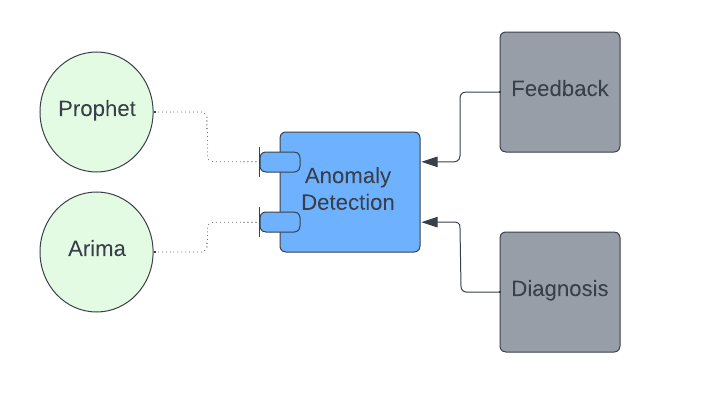
From a component perspective, D3 is structured in three main different areas:
Compute Layer: This component handles the computational aspects of the D3 system. It efficiently processes and analyzes data to identify any anomalies or drifts in the dataset.
Anomaly Detection: This component employs advanced algorithms and statistical techniques to automatically detect anomalies within the data. By comparing the current dataset state to historical patterns, D3 identifies any deviations and triggers alerts for further investigation.
Orchestrator: The orchestrator component acts as the central control unit of the D3 system. It coordinates the interactions between different components, manages the flow of data, and ensures seamless operation of the entire D3 architecture.
1) Compute Layer
The compute layer plays a central role in Uber's D3 framework. When a dataset is onboarded onto D3, two types of jobs are executed as part of the compute layer lifecycle:
One-Time Data Profiler Job: This job computes historical column monitor statistics for the dataset over the past 90 days. The resulting data serves as the training dataset for the anomaly detection model.
Daily Scheduled Job: This job computes column monitor statistics for the latest day and utilizes an anomaly detection algorithm to predict the statistical threshold and identify column drift for that day.
These compute jobs are implemented as generic Spark jobs that operate on each dataset. Monitors are expressed as SQL statements using Jinja templates. The D3 dataset configuration is utilized to translate these templates into actual SQL queries executed within the Spark application. The computed statistics from both the data profiler job and the daily scheduled job are stored in the Hive D3 stats table. Alerting and monitoring mechanisms are established on top of this table.
The compute layer of D3 leverages the power of Spark and SQL to efficiently process and analyze the dataset, enabling the identification of data drift and deviations from expected patterns. By persisting the computed statistics in a dedicated table, Uber ensures continuous monitoring and provides a foundation for timely alerts and further analysis of data quality issues.
2) Anomaly Detection at Uber
At Uber, data observability has traditionally relied on manually curated SQL-based tests with static alerting thresholds. This approach demands ongoing attention and recalibration to adapt to the ever-changing data trends. However, with the implementation of Anomaly Detection, Uber gains a more flexible and dynamic alerting system. Specifically for the D3 use case, Uber focuses on tuning the models to prioritize high precision and reduce the occurrence of false alerts.
The integration of any anomaly detection model into the D3 framework is designed to be plug and play. It leverages generic User-Defined Function (UDF) interfaces, allowing each model to have its own custom implementation. During the configuration process, users can conveniently select their preferred anomaly detection method without concerning themselves with the underlying technical details.
For any anomaly detection model, the input consists of time series data, while the expected output is the predicted limits within which the monitor value should fall. Although base limits can sometimes be more aggressive and lead to a higher number of false positives, Uber aims to employ a high-precision model. Typically, this involves defining conservative alerting limits in addition to the base limits. These alerting limits are dynamically determined based on the base limits, ensuring a responsive and accurate anomaly detection system.
By integrating Anomaly Detection into the D3 framework, Uber enhances its data observability capabilities. The ability to select and fine-tune anomaly detection models empowers Uber's tech audience to maintain a vigilant eye on data quality and swiftly identify any deviations from expected patterns.
3) Orchestrator
The Orchestrator component plays a vital role in Uber's D3 framework, serving as a service component that exposes D3 capabilities to the external world. It acts as a mediator, facilitating seamless communication between the Uber data platform and D3.
One of the key responsibilities of the Orchestrator is managing two crucial resources:
Metadata: Each dataset within D3 is associated with specific metadata, including dimensions, aggregators, supported monitor types, excluded columns, and partition-related information. This metadata determines the types of monitors that can be defined on the dataset. Additionally, it enables streamlined automated onboarding of datasets, simplifying the process with just a single click.
Monitors: The Orchestrator exposes gRPC endpoints that enable fetching and updating monitor-level information for a given dataset. This allows seamless interaction with and management of the monitors associated with the dataset.
The Orchestrator actively manages the lifecycle of D3 monitors, including profiling data, statistical computation, anomaly detection, and status updates to the components of the Uber Data Platform. It ensures that D3 remains synchronized with any changes in the dataset schema. Moreover, the Orchestrator supports both scheduled and ad hoc trigger-based statistical computation, enabling efficient and timely monitoring of data quality. Additionally, it facilitates monitor updates, such as handling metadata changes (e.g., dimension or aggregator modifications) and updates to monitor attributes (e.g., threshold or monitor type changes), ensuring that the corresponding monitors and statistics are appropriately updated.
To maximize the effectiveness of D3 in identifying data quality issues at scale and with speed, the recommended approach is to create D3-enabled tests through the user interface of Databook. To enable this seamless integration, the Orchestrator has been integrated with the Uber Data Platform, providing a unified and streamlined experience.
Uber's Data Platform, specifically the Unified Data Quality (UDQ) component, offers a generic API contract that allows any system to integrate, create, and maintain data quality tests and their lifecycles. The Orchestrator implements these functionalities to address the needs of data consumers, including:
Suggest Test: Recommending monitors to facilitate the onboarding process.
CRUD APIs: Providing essential functionalities for creating, reading, updating, and deleting monitors and associated data.
Backfill Test: Enabling the re-computation of statistics for past days, ensuring comprehensive analysis and coverage.
By leveraging the Orchestrator and its integration with the Uber Data Platform, D3 empowers data consumers with a powerful and versatile tool for maintaining data quality and effectively detecting any issues that may arise.
Alerting
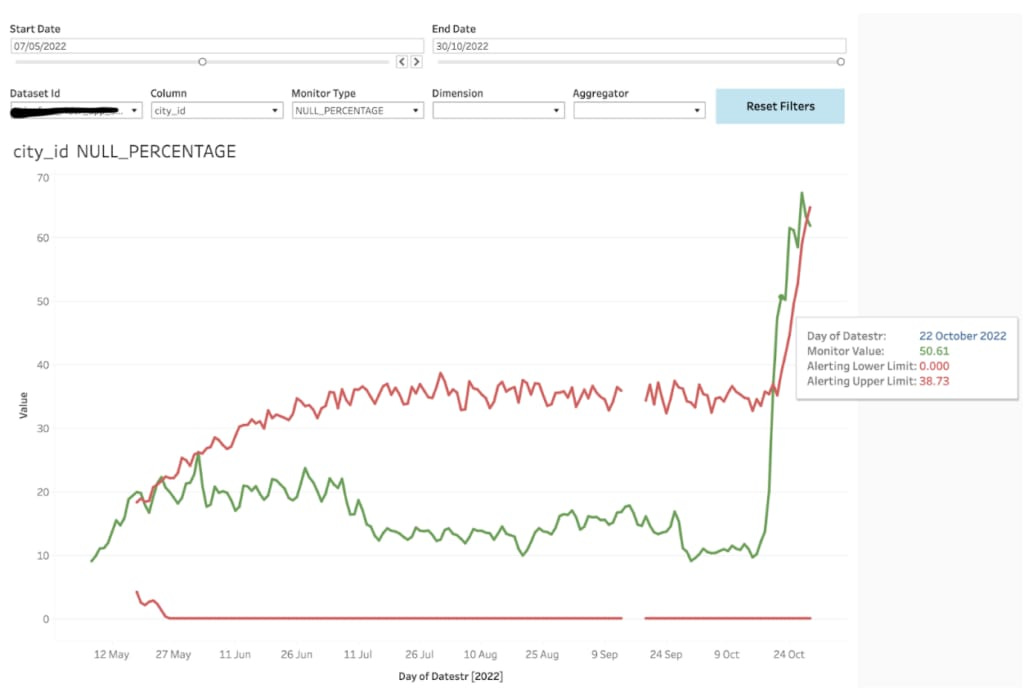
D3 has established a robust system for data quality alerting and monitoring to ensure the reliability and accuracy of its datasets. The computed statistics values, along with the dynamically generated thresholds from the data profiler and daily scheduled jobs, are securely persisted in a Hive-based stats table. This stats table serves as a critical resource for validating data quality and assessing the completeness and uptime of each dataset. To enable timely response and resolution, alerting mechanisms are seamlessly integrated with the databook monitoring service and pager duty on-call system, aligning with Uber's standard practices for service management. Whenever a threshold breach occurs in the persisted stats table, an alert is triggered, notifying the relevant teams for immediate action. Furthermore, the stats table plays a crucial role in configuring the tableau dashboard for data visualization, which is seamlessly integrated with the databook platform. This integration allows for a comprehensive and intuitive representation of data quality metrics, enhancing data exploration and analysis capabilities for Uber's tech audience.
D3 is one of the most complete reference architecture for data drifting at scale. Many of its components can be reused in enteprrise data quality pipelines. Uber has expressed that future work in D3 might include new data drift detection algorithms and ML model quality monitoring.


